MMM: Results
Posterior media contributions
Every posterior draw produces a full time-by-geography-by-media contribution tensor.
Additive contribution
For draw ,
In each posterior draw, a node's contribution equals its sampled effect coefficient times its sampled transformed response.
Terms: is the media contribution in posterior draw ; is the sampled effect coefficient; is the sampled transformed response.
Business reporting may use an outcome multiplier when the modeled target and reported KPI differ:
Reported business contribution equals model contribution multiplied by the conversion factor from modeled outcome to business KPI.
Terms: is the business-scale contribution; is the outcome conversion multiplier; is the model-scale contribution.
Profit contribution is
Profit contribution equals incremental outcome contribution times profit or business value per outcome unit.
Terms: is the profit contribution; is profit or business value per modeled KPI unit; is the incremental outcome contribution.
The business value may vary by time and geography, so monthly or weekly margins and profit-per-transaction values are supported.
Multiplicative contribution
The implementation exports both channel-removal counterfactual contribution and conserving effect-share allocation as defined in the Models tab (see Additive versus multiplicative specification). Reporting artifacts label the basis so downstream users do not mix the two meanings.
Aggregation and decomposition
Posterior contributions can be aggregated by:
- time, including weekly, monthly, and yearly rollups;
- geography;
- media node;
- parent media group;
- portfolio total.
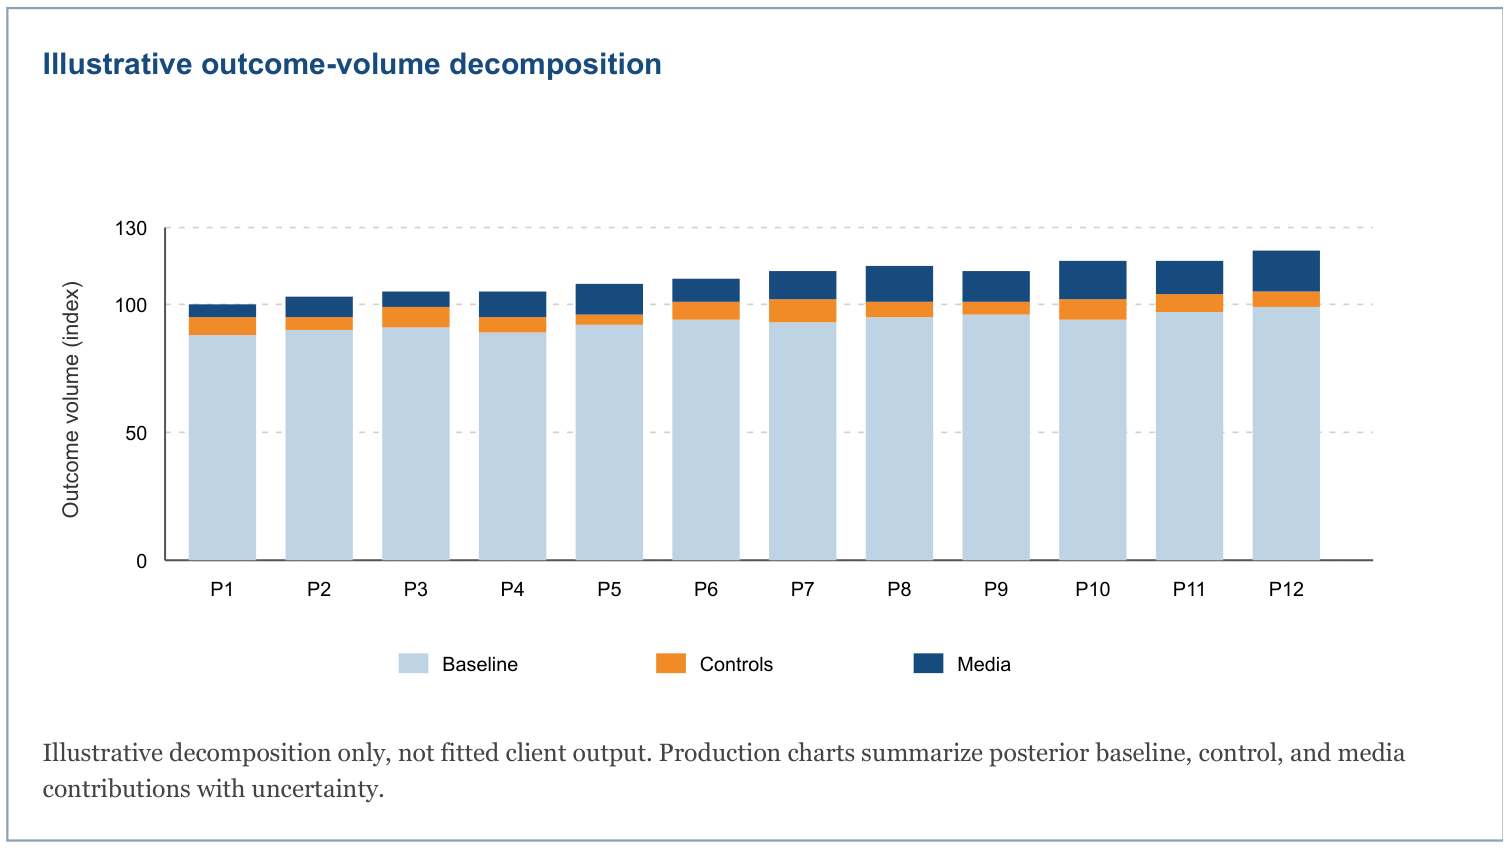
The decomposition separates base demand, controls, and media. Per-draw contribution percentage is
Contribution percentage equals a component's contribution divided by total predicted outcome, multiplied by 100.
Terms: is the selected component's contribution; is the total predicted outcome; identifies a posterior draw; multiplying by 100 converts the share to percent.
Summaries are computed after the nonlinear calculations and aggregation, which preserves posterior uncertainty correctly.
ROI and effectiveness metrics
General ROI
For reporting scope , such as a node, group, year, or portfolio,
ROI equals total incremental profit attributed to the selected scope divided by total media spend in that scope.
Terms: is ROI for scope in posterior draw ; is the incremental profit contribution; is media spend; defines the included times, geographies, and media nodes.
ROI is computed per posterior draw and then summarized. This is not generally equal to dividing two separately summarized quantities.
Outcome-specific interpretation
| Outcome | Implemented return interpretation |
|---|---|
| Volume | Incremental volume x unit margin / spend |
| Revenue | ROAS without margin; profit ROI with contribution margin |
| Profit | Incremental profit / spend |
| Conversions | Incremental conversions x profit per conversion / spend |
| Transactions | Incremental transactions x profit per transaction / spend |
| Transaction value | ROAS without margin; profit ROI with margin |
| Market share | Incremental share x market size x unit margin / spend, with percentage-point handling |
| Custom KPI | Incremental KPI x configured value per KPI unit / spend |
Effectiveness and efficiency
Incremental contribution describes effectiveness in outcome units. ROI combines that effectiveness with business value and spend efficiency. Raw coefficients should not be compared across media nodes without accounting for exposure scaling, transformation shape, and units.
The posterior contains media_beta draws for both model forms. In an additive model, that coefficient is derived from the sampled ROI and the fitting-period response denominator. In a multiplicative model, it is the sampled positive log-effect coefficient. The standard prior-diagnostic artifact reports the coefficient posterior for multiplicative models and the ROI posterior for additive models. The internal additive coefficient remains available in the posterior, but the standard business reports emphasize contribution and ROI, which are more comparable across differently scaled media nodes.
Response curves
The standard response-curve artifact is currently available for Weibull-CDF saturation. It evaluates the posterior curve on exposure multipliers from 0 to 3 times typical exposure, using 61 grid points by default, and reports mean, 5th, 50th, and 95th percentiles for response and curve parameters.
This artifact reconstructs the parametric Weibull-CDF saturation component. It does not apply the optional neural correction and should therefore be labeled as a parametric response-curve view when that correction is enabled.
The curve is a transformed-response curve used to understand diminishing returns and support later-stage planning decisions.
Uncertainty and posterior summaries
For a posterior-derived quantity , reports commonly include:
- posterior mean: ;
- posterior median: empirical 50th percentile;
- 90% credible interval: empirical 5th and 95th percentiles.
Uncertainty is propagated by calculating transformed response, predictions, counterfactuals, contributions, profit, and ROI separately for every posterior draw. This carries uncertainty from adstock, saturation, neural shape, baseline, controls, hierarchy, media effects, and observation noise into business outputs.
The posterior interval is a conditional Bayesian uncertainty statement under the selected model, priors, and supplied data. It is not a guarantee that model structure or source data are complete.