MMM Optimizer: Cross Brand
When to use it
Use cross-brand optimization when several brands are fitted as separate models but share one combined media budget, and you want to know whether budget should move between brands as well as between vehicles.
Typical questions:
- "Should some of Brand B's budget move to Brand A?"
- "Keep the combined budget flat. What is the best split across both brands?"
- "Brand A must grow by 5%. What is the best way to fund it?"
A single-brand run can only move money between a brand's own vehicles. A cross-brand run moves it across brand boundaries.
How it works
Each brand is fitted independently, so each brand's model stays exactly as fitted. For the optimization, the brands' vehicles are merged into one flat list and solved in one joint solve.
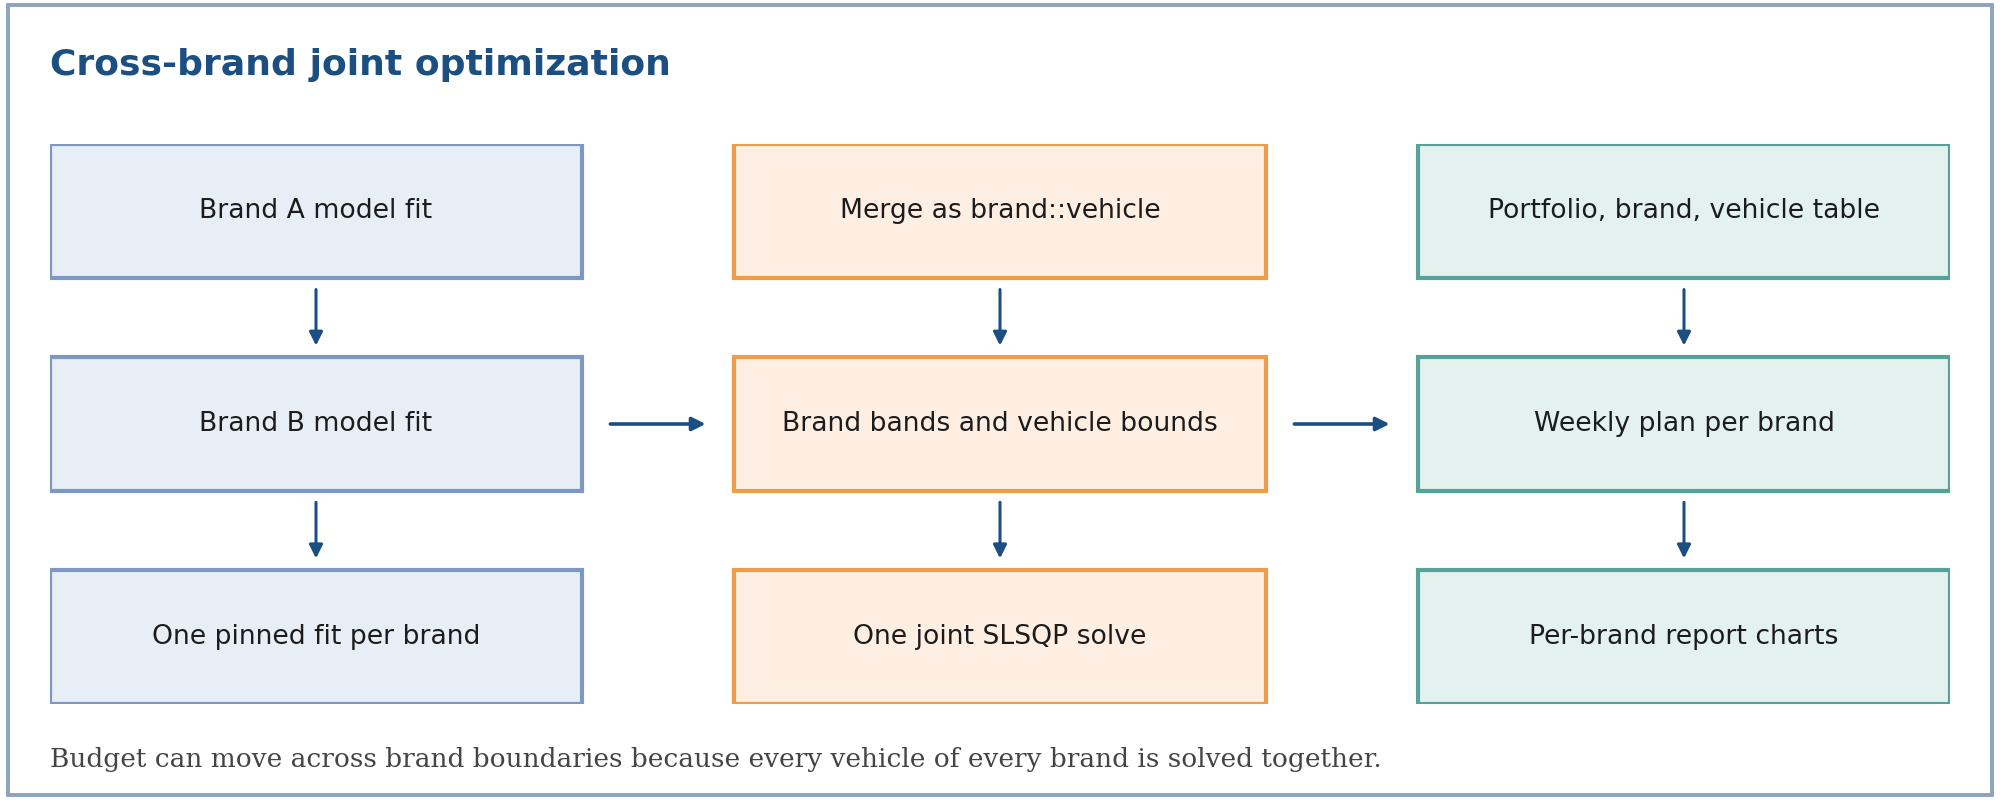
- One pinned fit per brand. The request names an exact approved fit for each brand. It is never resolved by brand label, which prevents a run silently picking up a different fit.
- Brand-qualified vehicles. Each vehicle is identified as brand and vehicle, so two brands can both have a TV vehicle without colliding.
- Brands may differ. Brands can have different vehicle sets and very different scales.
- No hierarchy in the solve. The solver sees a flat list of vehicles. Brands exist as groups for share constraints and as labels in the reports.
The cross-brand problem is the single-brand problem over the union of every brand's vehicles.
Terms: indexes a brand and a vehicle within it; is the vehicle's contribution to the objective (see Methodology); is the combined budget; and are the brand's minimum and maximum share of the combined budget.
At the optimum, every vehicle free to move earns the same marginal return across brands, not just within a brand. That is what makes a cross-brand reallocation meaningful.
Controls
| Control | Meaning |
|---|---|
| Combined budget change | Flat, increase or decrease by a percentage, applied to the movable spend of the whole portfolio |
| Brand limit | An increase or decrease for a brand's total (one-sided is a target, two-sided is a range), applied to that brand's movable spend |
| Vehicle limit within a brand | A limit on one brand's vehicle, resolved by brand and vehicle name |
| Default vehicle guardrail | ±15% for every vehicle without an explicit limit, widened only if the combined budget moves further |
| Brand movement cap | Every brand's total is held within ±10% of its movable spend by default |
| Locks | Non-paid media and vehicles that failed fit-quality checks stay at current spend |
| Macro assumptions | Media-cost and price inflation, applied to the optimized side of the reporting |
The brand band
Every brand always gets a band, whether or not you asked for a brand limit. The band is the intersection of the brand cap and what is actually reachable.
Reachable range for brand , given the other brands' own bounds.
Terms: and are the smallest and largest totals brand 's vehicles can reach under their own bounds; and are the same sums over all other brands. Because the combined budget is fixed, a brand's increase must be funded by other brands' decreases, so its total can only lie in this range.
Brand band with no explicit request: the brand cap, intersected with the reachable range.
Terms: is the brand's current spend; is its movable (unlocked) spend; and are the brand movement cap (10%, widened only when the combined budget moves further); is the ratio of target to current movable budget across the portfolio.
The brand cap is a hard ceiling. Unlike the vehicle guardrail, which fills in only when you gave no limit, an explicit brand request for more than the cap is clamped down and reported.
Explicit brand requests
A percentage on a brand applies to that brand's movable spend, the same basis as the combined-budget change and as the reports (locked spend is excluded). A request of +5% on a brand with 6 million movable and 13 million locked means +0.3 million, not +1 million.
A one-sided request becomes a target:
Target for a directional brand request, then clamped in this order.
Terms: is the requested change as a fraction of movable spend; is the requested brand total. When a target sits exactly on a limit, a 0.1% band is kept around it so the solver retains a sliver of room. Interior targets stay exact.
Requests are processed from the smallest dollar change to the largest, and each clamped target becomes a fixed bound for the next, so the full set is jointly feasible, the smaller request is met exactly, and the larger one is adjusted. The order you submit them in does not matter.
What is reported when a request cannot be met
Nothing is silently dropped. Every adjustment is reported with the requested and applied values and a reason:
| Reason | Meaning |
|---|---|
| Brand cap exceeded | The request was larger than the brand movement cap and was clamped to it |
| Channel limits | The brand's own vehicle limits cannot deliver that change |
| Other brands' capacity | With the combined budget fixed, the other brands cannot give up or absorb that much |
| All locked / no spend | The brand has nothing movable, so its limit was ignored |
| Brand cap infeasible | The cap could not be met together with the other brands' limits, so the wider reachable range was used |
| Unknown brand | The brand is not in this run, so its limit was ignored |
If every brand asked for a fixed change but the combined budget cannot fund them all, the output also states the combined-budget change that would make the requests consistent.
Worked example
This is an illustrative example on synthetic numbers, computed with the production solver. It is not client data.
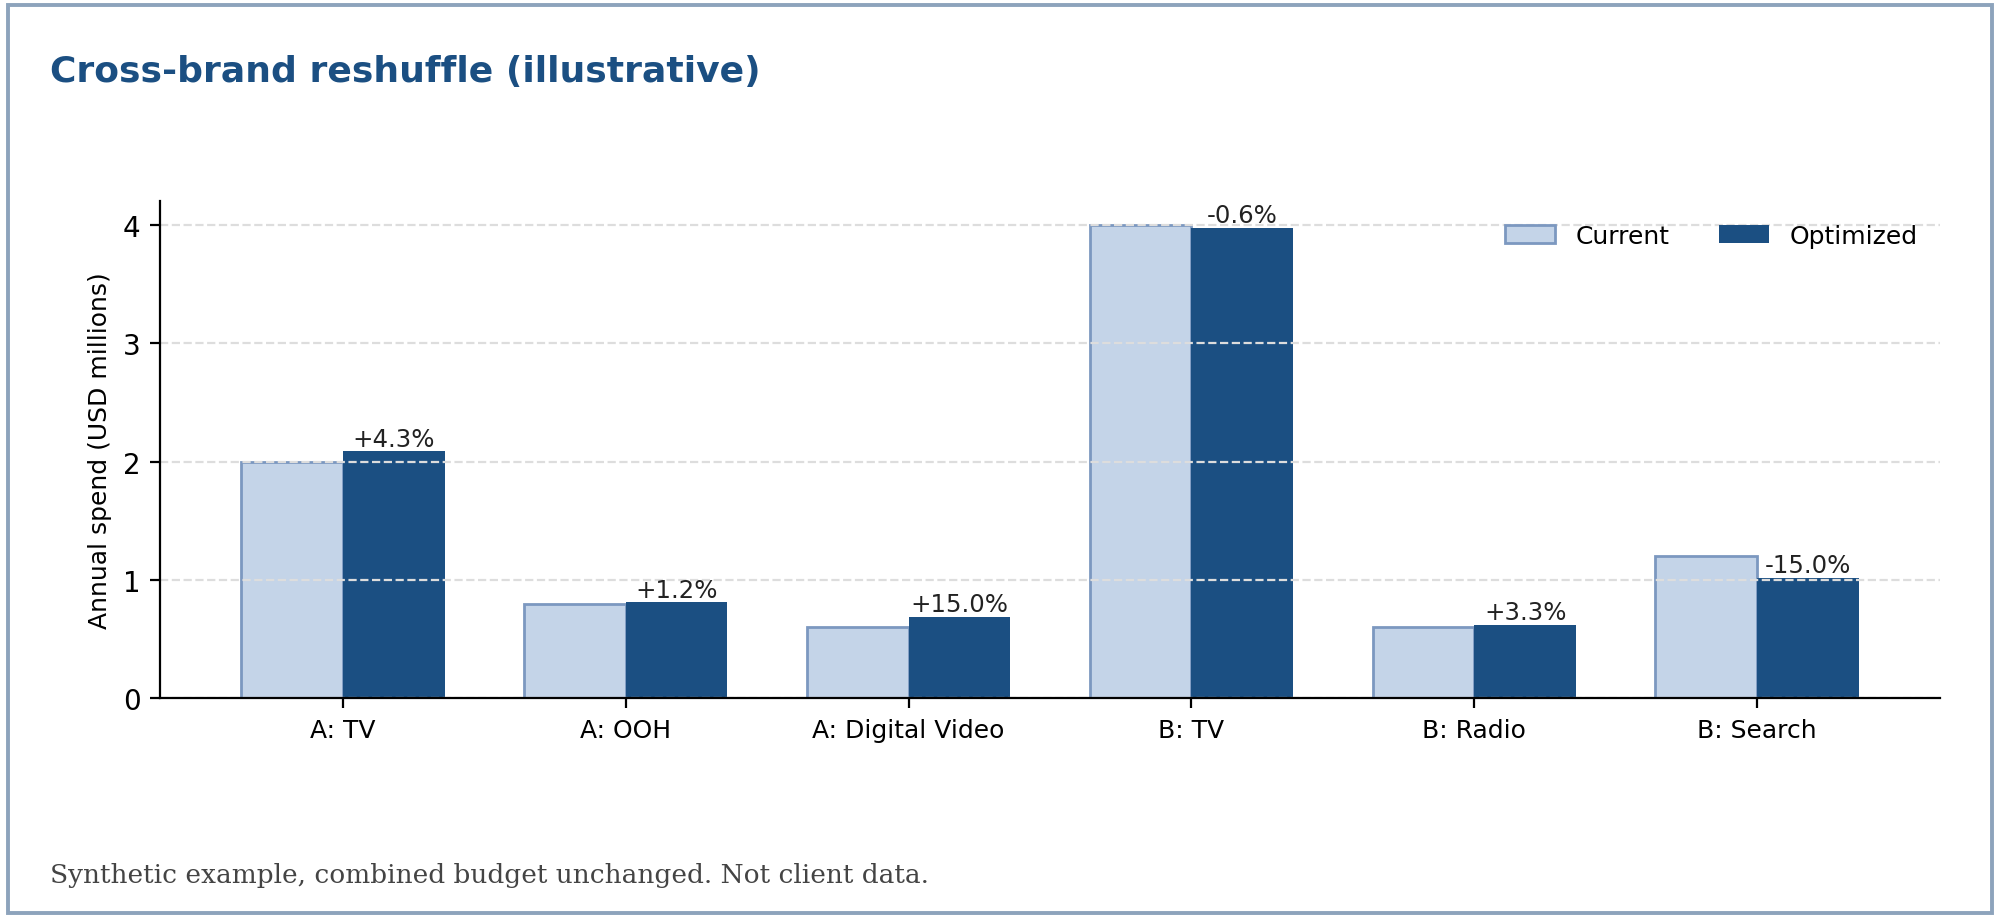
Setup. Two brands, Weibull-CDF curves, a combined budget of 9.2 million. Brand A has a profit value of 4.0 per unit and Brand B 3.4 per unit, on the same basis.
| Vehicle | Ceiling | Scale | Shape | Current spend |
|---|---|---|---|---|
| A: TV | 1,000,000 | 1,600,000 | 1.3 | 2,000,000 |
| A: OOH | 450,000 | 1,300,000 | 1.2 | 800,000 |
| A: Digital Video | 700,000 | 1,100,000 | 1.1 | 600,000 |
| B: TV | 2,100,000 | 3,800,000 | 1.3 | 4,000,000 |
| B: Radio | 300,000 | 500,000 | 1.5 | 600,000 |
| B: Search | 600,000 | 900,000 | 1.0 | 1,200,000 |
Reshuffle across both brands
| Vehicle | Current | Optimized | Change | Marginal ROI | At bound |
|---|---|---|---|---|---|
| A: TV | 2,000,000 | 2,086,126 | +4.3% | 0.858 | No |
| A: OOH | 800,000 | 809,776 | +1.2% | 0.858 | No |
| A: Digital Video | 600,000 | 690,000 | +15.0% | 1.469 | Upper |
| B: TV | 4,000,000 | 3,974,571 | −0.6% | 0.858 | No |
| B: Radio | 600,000 | 619,527 | +3.3% | 0.858 | No |
| B: Search | 1,200,000 | 1,020,000 | −15.0% | 0.730 | Lower |
Four vehicles across the two brands end at the same marginal ROI (0.858): that is the cross-brand equal-return condition. Brand A's total rises 5.5% and Brand B's falls 3.2%, with the combined budget unchanged. All validation gates pass.
Adding a brand-level request
| Request | Brand A total | Profit objective | Adjustments reported |
|---|---|---|---|
| None (reshuffle) | 3,585,902 (+5.5%) | 2,678,186 | None |
| Brand A +5% | 3,570,000 (+5.0%) | 2,678,124 | None; met exactly |
| Brand A +25% | 3,740,000 (+10.0%) | 2,672,342 | Clamped: first by the vehicle limits to +15%, then by the brand cap to +10% |
The +5% target is met exactly and costs almost nothing in profit. The +25% request is clamped to the 10% brand cap, and the output says so. The profit objective falls only slightly with each added constraint, which is how you read the price of a constraint. Lift in raw response units is not the right comparison here, because the two brands carry different unit values and the objective is profit.
Outputs
| Output | Content |
|---|---|
| Detailed media analysis | Level 1 is the whole portfolio, Level 2 one row per brand, Level 3 one row per vehicle labelled by brand and vehicle |
| Weekly flighting plan | Built once per brand from that brand's own history and attribution, then combined; the media type column carries the brand |
| Optimization summary | Solver status, validation gates, adjustments, assumptions, and any brand that was skipped |
| Report (PDF) | One weekly budget chart per brand, because a combined chart is misleading when brands differ greatly in scale |
If one brand's pinned fit is missing or no longer matches the request, that brand is skipped and reported, and the run continues with the rest. The run fails only if no brand can be resolved. The phasing baseline is the earliest of the brands' most recent complete years, so every brand is phased from a full year of history. A partly refreshed trailing year is never used as the baseline.
What you need to ensure
| Requirement | Why |
|---|---|
| Same response unit and value basis across brands | The solve equalizes marginal value across all vehicles, which is only meaningful if every brand's response and unit value are on one basis (for example incremental profit per unit). The optimizer does not check units or currency. |
| Annual spend in one currency and year basis | Curves are fitted on annual spend |
| One fit per brand | A brand appears once, with an exact approved fit |
| Independent source data | Two entries built from the same underlying data would count the same budget twice |
For the formulas behind each step, see mmm-optimizer-methodology.